FOI Request - Road Maintenance and Bin Collection
Request 101003036635
1. What is the percentage and figure of the road maintenance budget for the year 2021-2022? Again, what was this as a percentage and figure in 2007-2008?
2. If available, could you provide additional information regarding road maintenance – such as how many pot holes were filled in these years, as well as what distance of road was relayed in these periods?
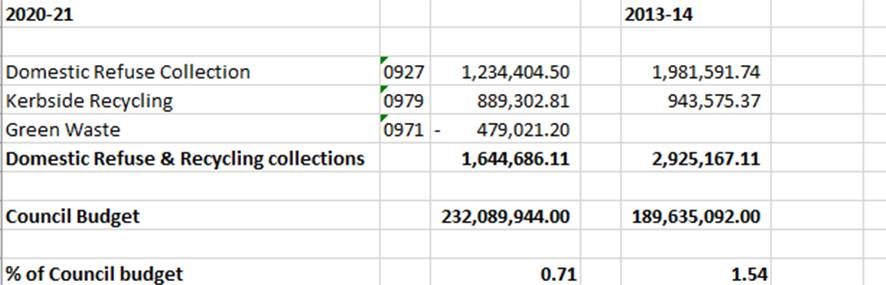
3. How many bins were collected in 2007-2008, and in 2021-2022? How much of the council’s budget was spent on refuse collections and recycling, both as a percentage and figure.
Where figures for 2007-2008 are not available, could you please provide the closest date appropriate, from 2007 forward.
Where figures for 2021-2022 are not available, please provide information for the most recent year. Could you also make me aware of when the 2021-2022 statistics will be available, where they are not already.
Response 27-04-2022
1. For the year 21/22:
Revenue Roads Maintenance Budget as a percentage of the overall Council Revenue Budget 1.55%
Capital Road Improvements Budget as a percentage of the overall Council Capital Budget 11.55%
2. We do not have carriageway defect repairs information back to 2007/2008.
2009/2010 = 1580no orders raised (these could be an order for 1 or many defects, and not all would necessarily be potholes)
2021/2022 = 5986no orders raised (these could be an order for 1 or many defects, and not all would necessarily be potholes)
Roads Re-laid (these figures include all resurfacing, reconstruction and surface dressing works):
2009/2010 = 70.2km
2021/2022 = 88.5km
3.
2007-2008
The number of properties were 38,521 of which 76% were classed as urban and 24% classed as rural.
The collection service for Urban properties was a fortnightly collection of general waste, garden waste, source segregated recycling of paper/card, glass, aluminium & steel cans, therefore each property had 5 different bins/boxes.
The collection service for Rural properties was a weekly collection of general waste only, no kerbside recycling, therefore each property had just one bin.
Therefore the total number of collections would be calculated as follows:
(Number of properties x number of bins) x number of collections = total number of bins serviced
Urban: (29,275 x 5) x 26 = 146,375 x 26 = 3,805,750 bins
Rural: (9,245 x 1) x 52 = 9,245 x 52 = 480,740 bins
Total number of domestic bins serviced in 2007-2008: 4,286,490
2021-2022
The number of properties were 45,676. All properties have full kerbside collections of 5 bins on a 3 weekly collection for general waste and recycling materials, and a fortnightly collection for garden/food waste, less one collection due to seasonal festivities.
Therefore the total number of collections would be calculated as follows:
General waste & Recycling: (45,676 x 5) x 17 = 228,388 x 17 = 3,882,460 bins
Garden/Food waste: (45,676 x 1) x 25 = 1,141,900 bins
Total number of domestic bins serviced in 2021-2022: 5,024,360
Budget: the information you requested can be found here.